Essential Chart是一个商业图表控件,他提供全新的数据对象模式,让图表可以和各种数据源轻松结合,Essential Chart的高级样式结构能够轻松表现复杂的多层次格式,企业版本(包含Essential Grouping)更增加了对分组功能的支持
Essential Chart is a business-oriented charting component. It offers an innovative data object model that makes it easy to populate a chart with any kind of data source. It features an advanced styles architecture which simplifies complex multilevel formatting.
(Chart is available for: ASP.NET,ASP.NET MVC, Silverlight, Windows forms, WPF)
一般特点 
Essential Chart是一个强大的数据可视化工具,它可以帮助您生成专业的图形和图表。它支持大量的各种图表类型并提供面向对象的API,这两者都具有功能强大和易于使用的特点。
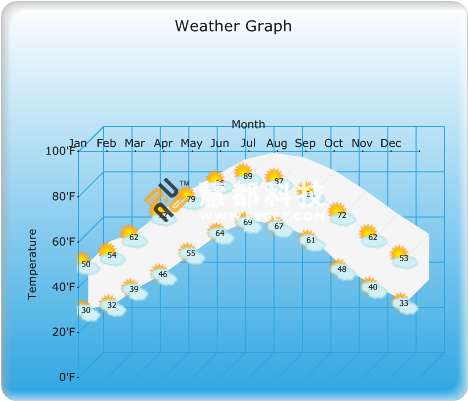
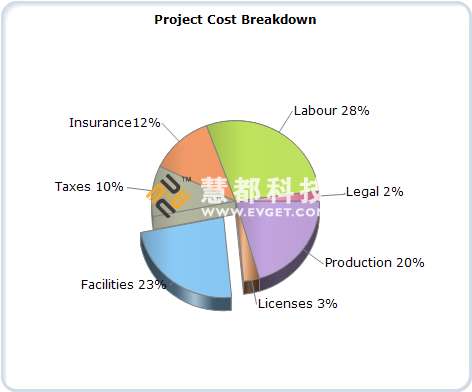
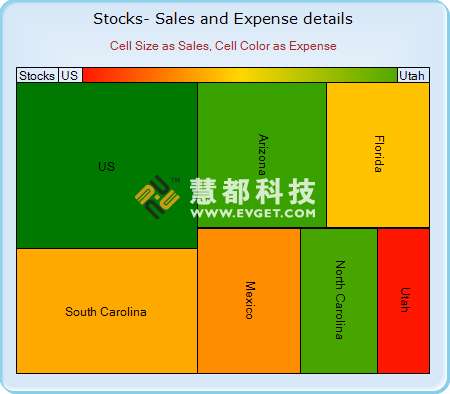
图表类型 
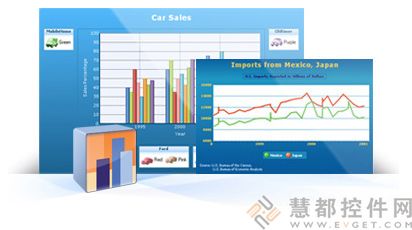
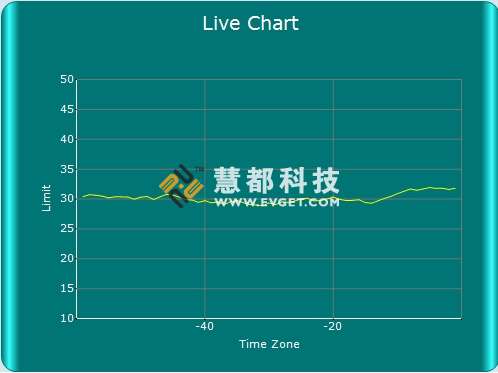
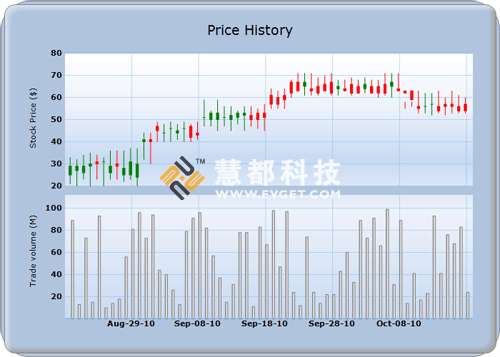
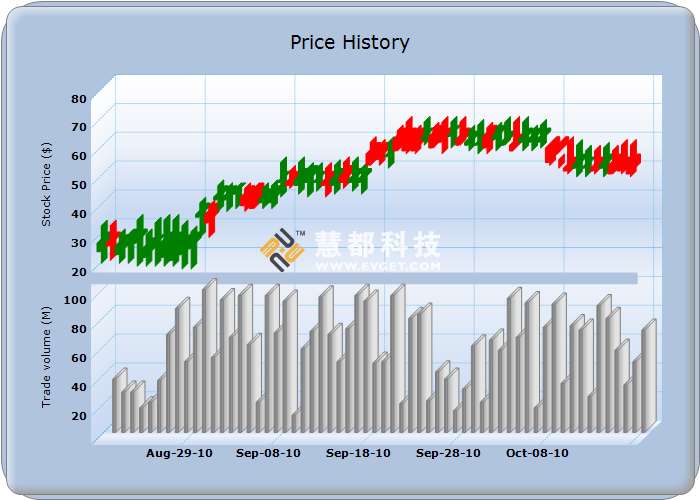
从简单的柱状图到复杂的金融图表Essential Chart for ASP.NET提供了超过35种图表类型。所有的图表除了Radar和Polar图表外都能够在3-D模式下渲染。
坐标轴特点 
默认的图表控制设置包括主x-和y-轴。该图表控制框架还提供了多x-和y-轴的包含的完全支持。
标题外观 
图表标题可以被定制以适合用户的需求。它的字体样式,大小和颜色可以被修改。对齐方式和图表标题的位置也可以被指定。Essential Chat还支持多图表标题。
更改序列数据和样式 
该Chart控件带有一个丰富样式结构,它将显示样式从数据模型分离而且为每一种显示元素的定义和外观提供了很好的灵活性。样式组成了Chart控件的核心并提供广泛的定制功能。它能够从一个父图表继承,这使得创建一个复杂格式的图表变得相对容易。
图表数据 
Essential Chart能够以不同的方式处理数据。您可以添加数据点到一个序列并让图表来管理它。另外,使用内置的ChartDataBindModel控件实现更容易的数据绑定到一个数据集并指定包含在x和y坐标轴中的值的列名。
图表外观 
一个图表的外观能够通过设置各个图表元素的属性被定制。它拥有的丰富的样式结构为Chart控件提供点级和序列级上的格式选项。
图表图例外观 
图表图例,它是一个基于符号的说明,它为图表中每个序列按默认设置被渲染。它还支持添加自定义图表图例。还有它提供用于外观的定制选项。Essential Chart还支持多图表图例。
交互式元素 
添加用户交互式元素到任何控件的需求。牢记这一点,该图表控件已被设计为具有完整的用户友好性并支持多种用户交互的元素。
General Features
Essential Chart is a powerful data visualization tool that helps you generate professional graphs and charts. It supports a large variety of chart types and sports an object-oriented API that is both powerful and easy to use.
Chart Type
More than 35 chart types ranging from simple column charts to complex financial charts are offered in Essential Chart for ASP.NET. All charts except Radar and Polar charts can be rendered in 3-D mode.
Axis Features
The default chart control settings include the primary x- and y-axes. The chart control framework also provides complete support for the inclusion of multiple x- and y-axes.
Title Appearance
A chart title can be customized to suit the needs of the user. Its font style, size, and color can be modified. The alignment and position of the chart title can also be specified. Essential Chat also supports multiple chart titles.
Alter Series Data and Style
The Chart control comes with a rich style architecture that separates the display styles from the data model and provides flexibility in the appearance and definition of each display element. Style forms the core of the Chart control and provides extensive customization. It can be inherited from a parent chart, which makes complex formatting relatively easy.
Chart Data
Essential Chart can handle data in different ways. You can add data points to a series and let the chart manage it. Alternatively, achieve easier data binding to a data set using the built-in ChartDataBindModel control and specify the column names containing the x and y coordinate values.
Chart Appearance
A chart's appearance can be customized by setting individual chart element properties. The rich styles architecture available for the Chart control provides formatting options at both point level and series levels.
Chart Legend Appearance
A chart legend, which is a symbol-based caption, is rendered for each series in a chart by default. There is also support for adding custom chart legends. There are also customization options for its appearance. Essential Chart supports multiple chart legends as well.
Interactive Elements
User interaction adds to the appeal of any control. Keeping this in mind, the Chart control has been designed to be completely user-friendly and supports several user-interaction elements.


 首页
首页 


 实时了解产品最新动态与应用


 相关产品
相关产品 授权相关问题
 微信
微信 在线咨询
在线咨询


 渝公网安备
50010702500608号
渝公网安备
50010702500608号

 客服热线
客服热线